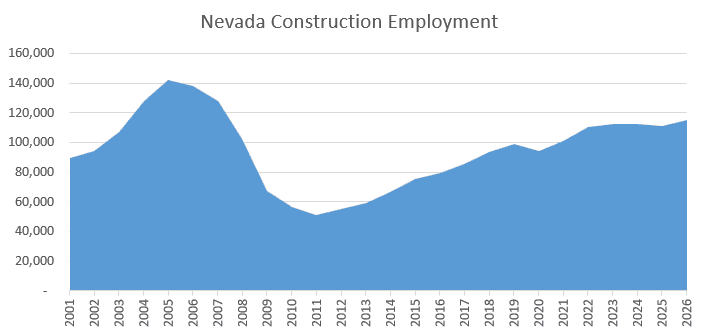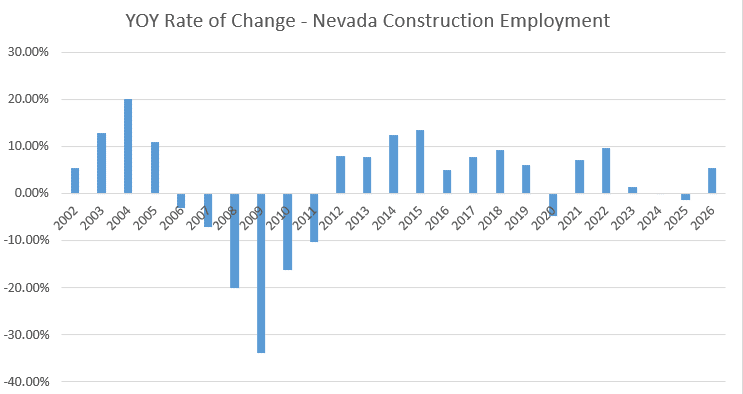













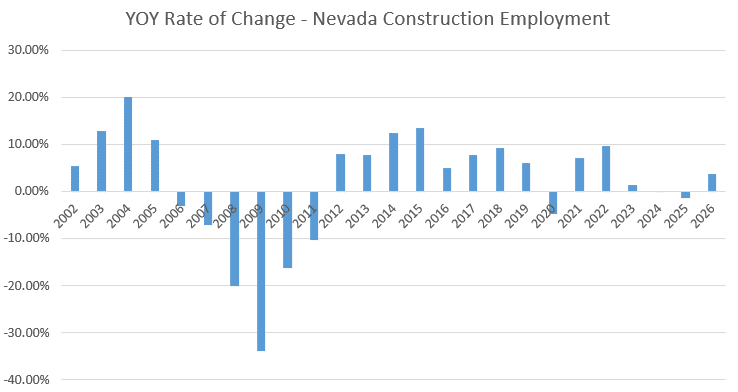
Seasonally adjusted Nevada Construction employment experienced a slight dip in June 2026 after remaining mostly flat in May.
The sector experienced a seasonally adjusted decline of 500 positions, which amounts to a 0.4% dip month-over-month.
Still, this has been an overwhelmingly positive year for the local Construction industry, with March being the only other month to report losses. In addition, the beginning of the year saw a 10,000-position upward revision.
Currently, there are 114,800 Construction jobs in the state. This signifies the previous report was revised downward by 700 roles. For reference, the December 2025 report initially listed 101,800 total jobs.
The highest Construction employment total to end the year was 142,200 in 2005. In 2006, the total continued to rise to 146,600 before falling to 137,700 by the end of the year.
Construction currently accounts for 7.1% of overall nonfarm jobs in the Silver State, according to nevadaworkforce.com.
In terms of year-over-year data, the sector is up 3,100 positions, a 2.8% improvement.
EDITOR’S NOTE: We are including both seasonally and non-seasonally adjusted data. Seasonally adjusted data continues to change after it is originally posted. The wider array of data is intended to provide a more accurate view of the market. To view our previous coverage, click here.
Non-Seasonally Adjusted Construction Data
Non-seasonally adjusted employment had a somewhat different June compared to its seasonally adjusted counterpart. Non-seasonal data, overall, remained completely flat.
The flatness was due to the conflicting growth and decline of its two subcategories: Construction of Buildings and Specialty Trade Contractors. The former, which is also the smaller of the two, gained 300 positions MoM, a 1.6% improvement. The subsector’s monthly growth is the equivalent of its yearly change.
Construction of Buildings totals 19,500 positions. At one point, the sector had 26,500 positions. It currently makes up 1.2% of statewide nonfarm jobs.
Specialty Trade Contractors currently has 85,900 positions. Its 300-position MoM dip accounts for a 0.3% loss. Regardless, the subsector has had an incredibly strong year, having gained 3,500 jobs, marking a healthy 4.2% improvement. The subsector accounts for 5.4% of the total nonfarm job pool.
Seasonally Adjusted Non-Construction Fields
The closely related Manufacturing sector grew by a mere 100 positions, or 0.1%, MoM to 68,400 positions. The sector has had an exceptionally strong year, as it is just 100 positions away from its record of 68,500 jobs.
Like Construction, Manufacturing is also split into two subsectors: Durable Goods and Nondurable Goods. Durable Goods gained 100 positions MoM, increasing its total by 0.2%. The subsector accounts for 46,100 total positions, which is its all-time high. YoY, the subsector has increased by 500 positions, which is an overall increase of 1.1%.
Nondurable Goods makes up the remaining 22,300 Manufacturing jobs. The subsector is only 700 positions below its record high. It remained completely flat MoM and shed 100 jobs YoY, which reflects a 0.4% decline.
Most sectors underwent modest changes over the course of the month. Both Trade, Transportation and Utilities and Professional and Business Services shed 0.3% of their totals MoM at -800 and -700 respectively.
Leisure and Hospitality experienced a numerically large gain of 1,700 jobs MoM, but, as it is by far and away the largest sector in Nevada, this only accounts for a 0.5% change. Government received the most severe change, having added 3,100 jobs MoM, marking an impressive 1.7% improvement.
Unemployment Metropolitan Statistical Area Data
According to a report by the Nevada Department of Employment, Training and Rehabilitation, unemployment throughout the state fell to 5.1%. Additionally, the labor force decreased by 6,845.
The report goes on to say, “The seasonally adjusted total number of nonfarm jobs in Nevada was 1,614,100, representing an increase of 2.3% over the past year and an increase of 3,800 jobs since May 2026.”
The Las Vegas Metropolitan Statistical Area gained 3,000 jobs MoM and 25,600 jobs YoY. The Reno MSA shed 600 jobs MoM but has still added 4,200 positions YoY. The Carson City MSA lost 100 jobs MoM and 200 jobs YoY.
The Bureau of Labor Statistics reported that, as of May 2026, Nevada has had the highest employment growth rate out of every state at 1.85%. The second fastest growing state was North Carolina at 1.22%.
As of May 2026, Nevada tied Oregon and Washington with the third highest unemployment rate in the country. The first spot is dominated by the District of Columbia, while California holds the second position.