


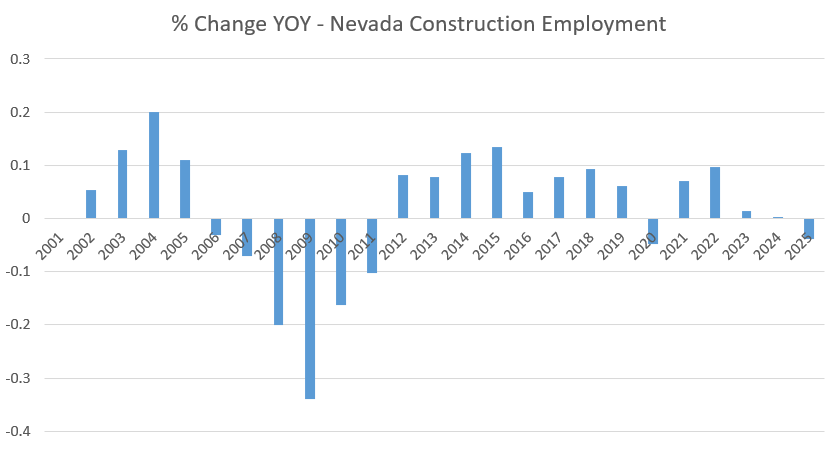
Construction employment in Nevada experienced a small bump in growth after consecutive months of poor showings.
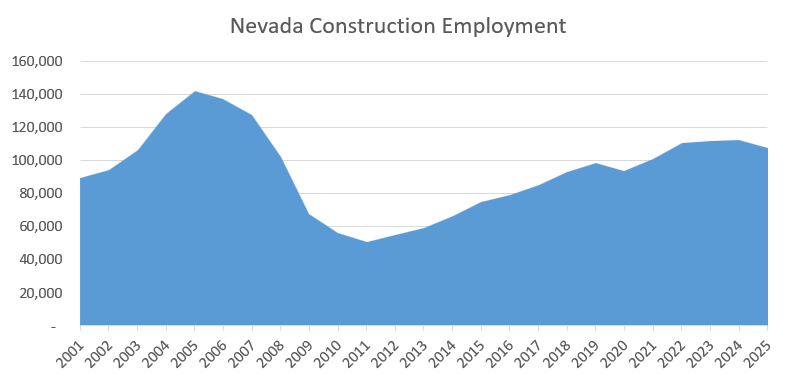
In terms of seasonally adjusted data, Nevada gained 400 positions month-over-month, which reflects a 0.4% increase. The current total Construction employment count is 107,900. Notably, this means that the total employment count in June was later revised from 106,600 to 107,500.
The largest Construction employment total to end the year was 142,200 in 2005. The total continued to rise to 146,400 in April of 2006 but fell to 137,700 by the end of the year.
With the increase, the sector now makes up 6.9% of total nonfarm employment in the Silver State, according to nevadaworkforce.com. In terms of year-over-year data, Construction employment has fallen by 2,400 positions, which accounts for a 2.2% decrease.
Construction and Manufacturing were tied for third in terms of overall growth. The only sectors to surpass the two were Other Services and Government.
EDITOR’S NOTE: We are including both seasonally and non-seasonally adjusted data. Seasonally adjusted data continues to change after it is originally posted; so the wider array of data is intended to provide a more accurate view of the market.
Non-Seasonally Adjusted Construction Data
Non-seasonally adjusted data pegged Construction at 108,500 jobs at the end of July, which is the same total reported for the month of June.
The report, however, indicates that 900 jobs were shed over the month, which means the total from June was later revised to 109,400. The 900 jobs lost represent a decline of 0.8%.
The sector has lost 3,400 non-seasonally adjusted positions YoY, which reflects a loss of 3%.
Non-seasonally adjusted data splits Construction into two subsectors: Construction of Buildings and Specialty Trade Contractors.
Both subsectors lost 400 jobs over the course of the month. This carries a heavier impact on Construction of Buildings, as it is a much smaller subsector. The subsector makes up a grand total of 1.1% of the nonfarm employment market with 17,800 positions.
Construction of Buildings has shed 500 jobs YoY, which represents a total decline of 2.7%. The subsector once peaked at 26,500 positions.
In comparison, Specialty Trade Contractors has a total of 79,800 positions. The 400 jobs lost reflect a total decline of 0.5% MoM. The subsector makes up 5.1% of overall nonfarm employment.
Specialty Trade Contractors has, however, had a harder year, as the subsector has lost 2,500 YoY positions, which reflects a 3.0% loss.
Seasonally Adjusted Non-Construction Fields
The closely related Manufacturing sector has set a record high total employment count with the addition of 400 positions. The sector now sits at 67,900 jobs, while its previous record was 67,700. The 400-job increase represents a monthly growth rate of 0.6%. YoY, the sector has created 1,500 positions, which reflects a 2.3% increase.
Both of Manufacturing’s subsectors, Durable Goods and Nondurable Goods, experienced monthly growth. Durable Goods, the larger of the two subsectors, grew by 300 positions, or 0.7%. The subsector has had a strong year, as it has had a YoY growth of 1,900 positions, or 4.3%. The subsector totals 45,900 positions.
Nondurable goods grew by 100 positions MoM, which reflects a 0.5% rate. The subsector is currently at 22,000 positions, which is just 1,000 shy of its peak. The subsector has lost 400 YoY positions, which accounts for 1.8%.
Private service-providing jobs experienced substantial losses, with only three sectors picking up a small number of jobs. Trade, Transportation and Utilities grew by 300 positions over the month, Information grew by 100, and Other Services grew by 500.
Leisure and Hospitality, the largest sector in the state, shed the largest quantity of jobs, having lost 1,800 positions. This is a MoM decrease of 0.5%. The entirety of the loss was from the Accommodation and Food Services subsector. The Arts, Entertainment and Recreation subsector remained flat.
The sector has, as a whole, still experienced a positive year in terms of job growth. It has gained 3,300 YoY jobs and currently makes up 23.2% of overall employment in Nevada.
The largest gain across all sectors was seen in Government. The sector gained a total of 2,300 monthly positions, which reflects a 1.3% growth. The sector now sits at 184,900 positions, which is 11.7% of the nonfarm employment total in the state.
All the gains seen in the sector stemmed from Local Government. The State Government subsector lost 100 jobs, while the Federal subsector remained stagnant.
Area-Based Employment and Unemployment
The Las Vegas Metropolitan Statistical Area experienced a 0.4% growth rate with the introduction of 4,200 jobs. The Reno MSA remained mostly flat, with the addition of 100 jobs MoM. The Carson City MSA was the only one to report a decrease in employment, having lost 200 jobs.
The State of Nevada had the second-highest unemployment rate in the nation, behind the District of Columbia. The State of California tied the Silver State with an unemployment rate of 5.4%. This is substantially lower than the District of Columbia, which sits at 5.9%.
Nevada is one of the 15 states with a higher unemployment rate than the national average.