


Statewide Construction employment reflected very different performances across seasonally adjusted and non-seasonally adjusted data for September.
In terms of seasonally adjusted data, Nevada gained 1,000 positions month-over-month. This reflects a 1.0% monthly increase. Statistics demonstrate the end of September had 105,200 Construction jobs. Notably, this means the employment count for August was revised upward by 700 positions.
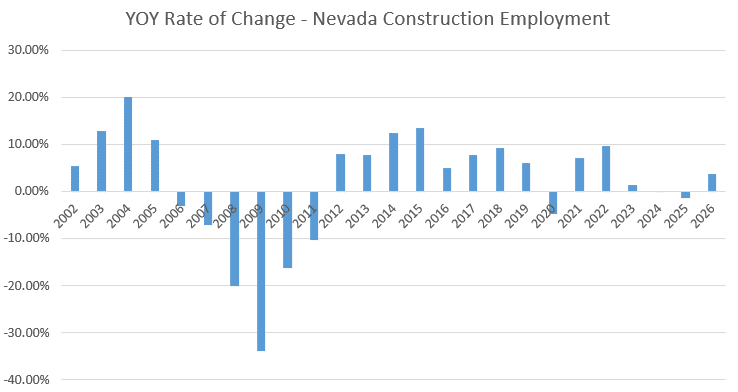
The highest Construction employment total to end the year was 142,200 in 2005. In 2006, the total continued to rise to 146,600 before falling to 137,700 by the end of the year.
As of September, the sector makes up 6.7% of total nonfarm employment in the Silver State, according to nevadaworkforce.com. Construction is still on the decline, as employment in July reflected 6.9% of total nonfarm employment.
Employment statistics were delayed due to the recently ended government shutdown, giving the Bureau of Labor Statistics more time to revise previous numbers and account for September. October and November data will likely follow soon.
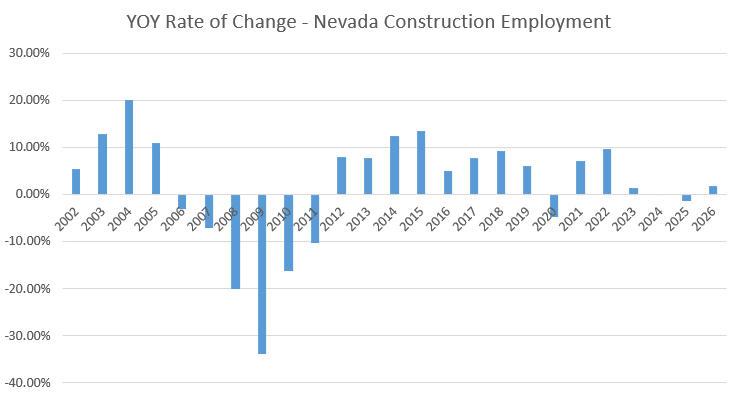
In terms of year-over-year data, Construction employment has fallen by 5,500 positions. This reflects a decrease of 5%.
As far as seasonally adjusted data goes, Construction had the third-best month of all nonfarm sectors. The second-highest numerical growth was seen in Professional and Business Services, which netted an additional 1,800 positions. Leisure and Hospitality, the largest sector in Nevada by a wide margin, gained 5,100 positions over the course of the month.
EDITOR’S NOTE: We are including both seasonally and non-seasonally adjusted data. Seasonally adjusted data continues to change after it is originally posted, so the wider array of data is intended to provide a more accurate view of the market.
Non-Seasonally Adjusted Construction Data
Non-seasonally adjusted Construction data had a very different story, showing the sector shed 900 positions. This reflects a total of 105,000 jobs across the entire sector.
The 900 lost positions reflect a decrease of 0.8% MoM. The sector has also lost more positions YoY, with the report showing 7,100 fewer jobs. This equates to 6.3% of statewide construction jobs.
Non-seasonally adjusted data splits Construction into two subcategories: Construction of Buildings and Specialty Trade Contractors.
Construction of Buildings, the smaller of the two subsectors, lost 300 positions MoM. In terms of percentage, this is roughly 1.7%. YoY, the sector has lost 1,300 positions, or 7.1% of its workforce.
The sector now has 17,100 positions. The subsector once peaked at 26,500 jobs. Currently, the subsector makes up 1.1% of nonfarm employment.
Specialty Trade Contractors lost 600 positions MoM. This reflects an overall decline of 0.8%. In terms of YoY data, the subsector has lost 6,100 jobs, which is a 7.4% decline. The subsector once employed 107,200 people. It currently makes up 4.8% of total nonfarm employment.
Seasonally Adjusted Non-Construction Fields
The closely related Manufacturing sector stayed mostly flat throughout September, albeit with a slight dip. Manufacturing currently sits 400 jobs shy of its all-time peak of 67,700.
The sector lost a net 100 positions, or 0.1% of its stock. YoY, however, the sector has gained 200 positions, or 0.3%.
Manufacturing also has two subsectors: Durable Goods and Nondurable Goods. The larger subsector, Durable Goods, lost 200 positions MoM, or 0.4%. The subsector has still boasted a healthy gain of 1,100 positions YoY, which is a growth rate of 2.5%.
Nondurable Goods gained 100 positions MoM, which is a 0.5% growth rate. The sector has been on a decline over the course of the year, having lost 900 positions, a 4% dip.
Save a handful of sectors, September was primarily comprised of small changes. The steepest decline was seen in Government by a wide margin. Local Government lost 2,500 positions over the course of the month, while Federal positions declined by 100. State Government was the only subsector to experience growth, having added 500 positions.
Leisure and Hospitalitygrew the most over the course of the month. The entirety of its growth was seen in Accommodation and Food Services, which added 5,500 positions. Arts, Entertainment and Recreation experienced a slight dip of 400 jobs MoM.
Despite narratives of the overarching decline of tourism in Las Vegas over the course of the year, statistics show that jobs in the Leisure and Hospitality sector have grown by 2,800 roles, or 0.8%. Currently, the sector makes up 23.3% of total non-farm jobs in the Silver State. This accounts for 366,900 positions.
Professional and Business Services experienced all its growth in the Administrative and Waste Services subsector. The sector grew by 1,800 jobs MoM, which is 0.8% of its overall employment. Management of Companies and Enterprises gained 100 positions, while its other subsector, Professional and Technical Services, fell by 100 positions.
Unemployment Metropolitan Statistical Area Data
According to a report by the Nevada Department of Employment, Training and Rehabilitation, unemployment throughout the state remained completely flat at 5.3% across September. While the unemployment rate was unchanged, the labor pool increased by 1,289 individuals.
Total nonfarm jobs in September reached 1,575,600, which is an increase of 5,100 jobs since August. The Las Vegas Metropolitan Statistical Area gained 4,400 jobs MoM. This reflects a YoY increase of 2,300 positions.
The Reno MSA increased its number of jobs by 1,100, or 0.4% MoM. It has experienced a 0.2% increase YoY, which equates to 700 new roles.
The Carson City MSA was the only of the three major MSAs in Nevada to lose jobs. The MSA lost 200 jobs, which equates to a 0.6% MoM decrease. It has lost 100 jobs YoY, which is the equivalent of 0.3%.
Nevada is still ranked third worst in the country for unemployment, ranking just ahead of California with an unemployment rate of 5.5% and the District of Columbia with an unemployment rate of 6.0%.