


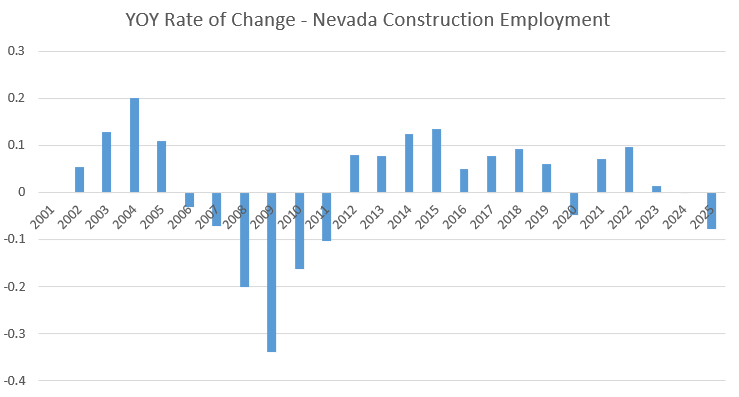
Construction employment experienced its steepest decline of the year in August after dwindling for months.
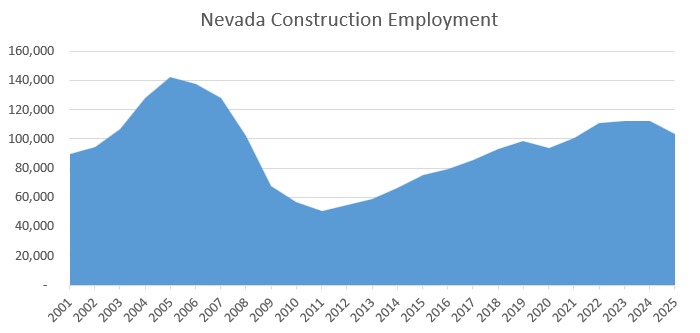
In terms of seasonally adjusted data, Nevada lost 4,400 positions over the course of the month. This reflects a 4.1% overall decrease. The current total Construction employment is at 103,500. Notably, this means the employment count for July was not revised.
The highest Construction employment total to end the year was 142,200 in 2005. In 2006, the total continued to rise to 146,600 before falling to 137,700 by the end of the year.
With the heavy decline, the sector now makes up 6.6% of total nonfarm employment in the Silver State, according to nevadaworkforce.com. For reference, in July, Construction employment reflected 6.9% of total nonfarm employment.
In terms of year-over-year data, Construction employment has fallen by 7,100 jobs. This reflects a decrease of 6.4%.
Construction had the highest month-over-month and YoY decrease. Closely followed was Leisure and Hospitality, which lost 4,100 positions. As Leisure and Hospitality is the largest sector in the Silver State, this only reflects a decrease of 1.1%.
EDITOR’S NOTE: We are including both seasonally and non-seasonally adjusted data. Seasonally adjusted data continues to change after it is originally posted, so the wider array of data is intended to provide a more accurate view of the market.
Non-Seasonally Adjusted Construction Data
Non-seasonally adjusted Construction data indicated there were 105,300 total positions by the end of August.
The non-seasonally adjusted report found that the state only shed 3,700 positions MoM. This reflects an overall decrease of 3.4%.
The sector lost slightly more positions YoY in non-seasonally adjusted data, with a decline of 7,400. This reflects a YoY decrease of 6.6%.
Non-seasonally adjusted data splits Construction into two subcategories: Construction of Buildings and Specialty Trade Contractors.
Construction of Buildings lost 500 positions MoM, which is an overall decrease of 2.8%. The subsector has seen a decline of 1,000 positions YoY, which reflects a 5.4% dip.
The sector now has 17,400 positions. The subsector once peaked at 26,500 jobs. Currently, the subsector makes up 1.1% of total nonfarm employment.
Specialty Trade Contractors, the largest of the two subsectors, lost 2,500 positions MoM. This is an overall decline of 3.1%.
In terms of YoY data, the sector has shed 5,500 positions, which is a 6.6% decline. The subsector once had a maximum employment of 107,200 people. After the decline, the subsector makes up 5% of total nonfarm employment.
Seasonally Adjusted Non-Construction Fields
The closely related Manufacturing sector remains near its all-time high of 67,700 positions. In August, the sector had a total of 67,600 jobs. Notably, the sector, and its all-time high, were revised slightly downward after the July report.
The sector benefited from the addition of 100 jobs, which is a 0.1% increase MoM. Over the course of the year, the sector has gained a total of 900 positions, which is a 1.3% growth rate.
Manufacturing is split between two subsectors: Durable Goods and Nondurable Goods. Durable Goods, the larger of the two, was the only subsector to experience a monthly gain. The subsector gained 100 MoM positions, which is a 0.2% growth rate.
Durable Goods has gained 1,600 positions over the year, which is a 3.6% growth rate. The subsector now boasts 45,800 positions, which is near its all-time high of 46,000.
Nondurable Goods remained completely flat throughout August, maintaining its 21,800 positions. The subsector is still coming off its peak employment count of 23,000 jobs.
YoY, the subsector has shed 700 positions, which is a shrinkage of 3.1% of jobs.
Overall, private service-providing sectors experienced mixed results throughout August. Sharp declines were seen in Trade, Transportation and Utilities, as well as the aforementioned Leisure and Hospitality. Information and Financial Activities remained mostly flat. Professional and Business Services, Education and Health Services and Government experienced the highest gains.
Trade, Transportation and Utilities has continued to shed positions throughout the second half of 2025, with the sector shedding 1,000 MoM jobs. The decline was driven by its Retail Trade and Transportation, Warehousing and Utilities subsectors. The sector remains Nevada’s second largest, making up 18.6% of total nonfarm employment.
Government experienced the highest increase throughout August, gaining a total of 2,200 positions. The entirety of the gain was seen in the Local Government subsector, while the State Government and Federal subsectors experienced negligible increases and decreases that cancelled each other out.
Unemployment Metropolitan Statistical Area Data
According to a report by the Nevada Department of Employment, Training and Rehabilitation, unemployment throughout the state decreased by 0.1% MoM. Currently, unemployment sits at 5.3%. This is marked by a decrease in the labor force of 1,303.
The Las Vegas Metropolitan Statistical Area lost 4,300 positions MoM and 5,000 jobs YoY. The Reno MSA lost 400 MoM positions but has gained 800 jobs YoY. The Carson City MSA had an increase of 300 jobs MoM and an increase of 100 YoY positions.
DETR’s report indicated that the number of available positions has largely remained unchanged over the course of the year. It was reasoned that the cause of the dip in unemployment was due to the shrinkage of the labor market.
Out of all 50 states and the District of Columbia, Nevada is ranked 49th in unemployment with 5.4%. California has a slightly higher unemployment rate at 5.5%, and the District of Columbia has the highest unemployment rate at 6.0%. The average unemployment rate in the United States is 4.5%.
Despite Nevada’s poor ranking, the report found that it was tied for 39th in terms of highest YoY employment growth.