


After years of wild vacillation, the cumulative U.S. Multifamily market is showing signs of moving toward stabilization. Individual markets, however, all have their own stories to tell.
Colliers’ Q1 2026 United States Multifamily report calls the current circumstances, “A rebalancing phase,” after a “recalibration period” to end 2025. At year’s end, the sector was still dealing with higher-than-normal deliveries and the resulting slowing of rent growth.
The report finds conditions started to become more balanced over Q1 of this year.
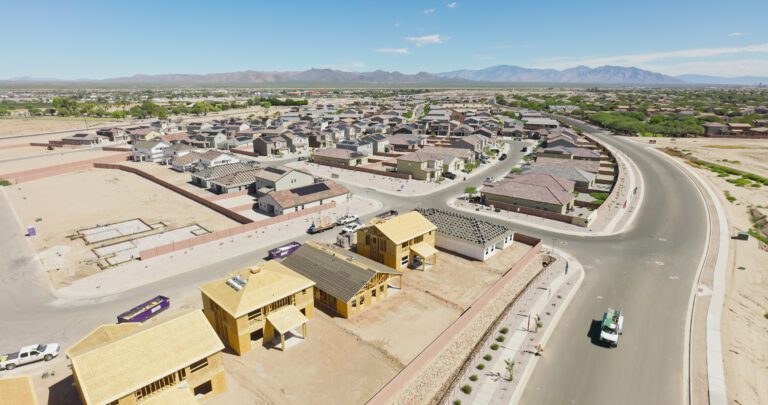
Due to ongoing affordability constraints in the for-sale housing market, demand in Multifamily remains high, while new deliveries are showing signs of peaking. New starts are down significantly as the construction segment slows to let absorption start to catch up.
Investors and lenders are focusing on markets with easing supply pressures and strong ongoing long-term fundamentals. High-delivery markets are seeing supply moderating and demand remaining steady, providing an optimistic operating environment for owners.
Colliers expects the trend to continue into 2027, although the regional geography and the quality of assets will remain significant influences.
The National Snapshot
Colliers examines data from 60 top markets to compile its U.S. report.
The Q1 2026 national inventory stood at 18,430,704, an increase of 314,353 units over Q1 2025. Q4 2025 ended with 18,366,456.
New supply for Q1 totaled 64,456 units, compared to 78,641 at the end of Q4 and 99,591 at the end of Q1 2025.
Q1 absorption was strong nationally, coming in at 85,086 units. Q4, by contrast, had experienced negative absorption of 24,801 units. Despite Q1’s comparatively strong showing, it paled in comparison to Q1 2025, which reported 133,390 units absorbed.
The national occupancy rate was high, with only nominal changes across the year. Q1 2026 reported 95.1%, while Q4 2025 was at 95.0%, and Q1 2025 was 95.2%.
Rent growth showed positive change for owners, rising from an average effective monthly rent of $1,894 in Q1 2025 to $1,919 in Q4 and then to $1,934 in Q1 2026.
The construction pipeline was, perhaps, the most telling. In Q1 2025, units under construction stood at 573,272. That count had dropped to 529,509 in Q4, falling still farther to 501,117 in Q1 2026.
While distress is gaining a higher profile across Multifamily, it is more likely to be seen in local markets, rather than the overall national picture.
Speaking regionally, the report says, “In portions of the Sun Belt, stress is emerging where supply pressure has delayed rent recovery, compressing cash flow ahead of loan maturities.”
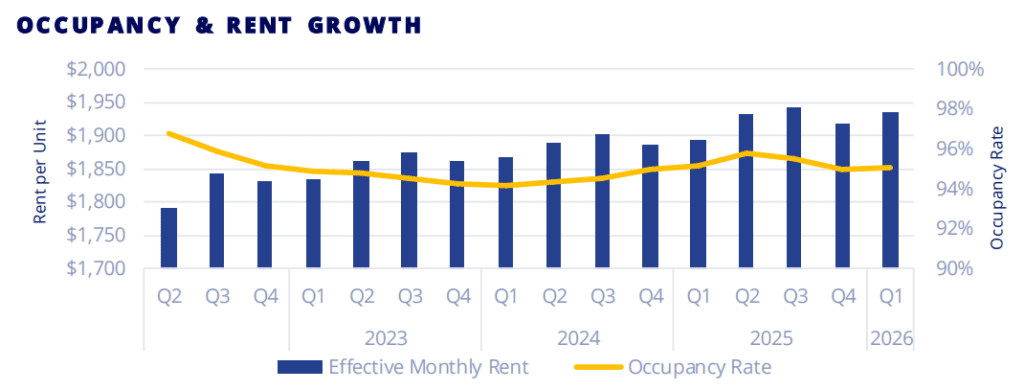
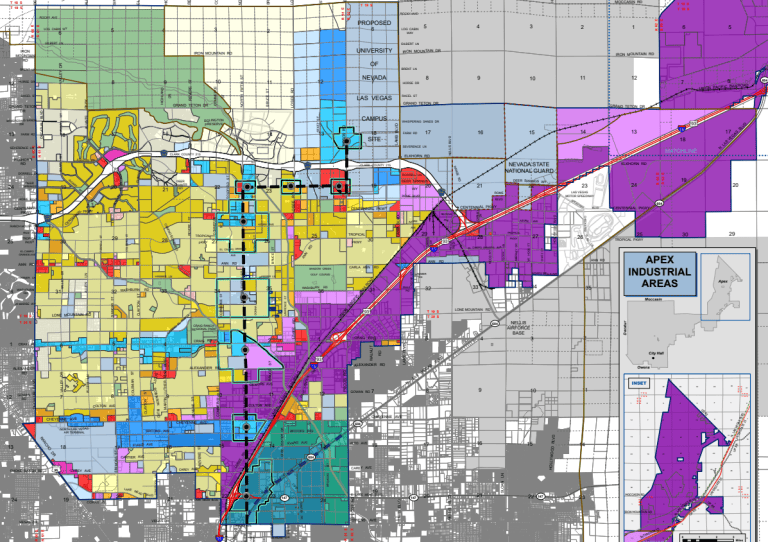
Occupancy and Rent Fall in Las Vegas
Units under construction show the wild swings in pace between markets across the country. The Las Vegas Metropolitan Statistical Area sits toward the bottom with 4,508 units under construction.
For contrast, Newark boasted the highest number of units under construction at 33,987, while there was not a single unit under construction in Honolulu.
Deliveries outpaced absorption in Las Vegas in Q1 despite the housing shortage. The MSA saw 805 units absorbed against 1,015 deliveries.
By the end of Q1 2026, Las Vegas’ total Multifamily inventory sat at 241,207 units. The occupancy rate fell to 94.1%, which is down 0.6% year-over-year.
The average monthly effective rent fell 2.9%, bringing the average rent to $1,421.